The impacts of climate change are expected to increase the need for and scope of adaptation amongst farmers in Denmark. A recent questionnaire conducted by BASE partner Aarhus University reveals insights onto how farmers in Denmark perceive climate change, and how these perceptions are influencing their decision making.
By Anders Branth Pedersen and Helle Ørsted Nielsen, Aarhus University
Agricultural production is widely affected by both the biophysical impacts of climate change and the resulting socio-economic impacts (1). Farmers are used to coping with year-to-year changes in climate, but human-induced climate change is still expected to accelerate the need for (and magnitude of) adaptation by farmers (2). The European Commission expects that impacts of climate change on agriculture will be increasingly visible towards 2050 (3).
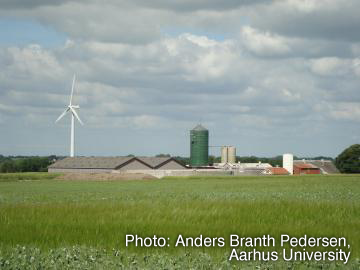
Farmland in Denmark (Photo credit: Anders Branth Pedersen, Aarhus University)
As part of BASE’s case studies on Danish agriculture, online surveys have been distributed to farmers in the Danish municipalities of Holstebro and Lolland. Furthermore, in collaboration with NORD-STAR, an online survey was distributed to approximately 3.000 Danish farmers nationwide (with >1.000 responses). Analysis of the data is still in progress, but we present here a few of the preliminary findings from the two Danish municipalities. The number of responses in these local surveys was very limited, but we find that there are some interesting results.
Both Lolland and Holstebro experienced extreme climate-related events in 2011. Lolland is an island situated in the South-Eastern part of Denmark which experienced severe farmland flooding in August 2011 following heavy rainfall. Holstebro is situated in the North-Western part of the country and, in January 2011, experienced the most severe flooding problems in Denmark since 1970. The municipality and its main city, Holstebro, is traversed by Denmark’s second-longest water course, Storå, which rose and flooded the center city following sudden snow melt and rains (
4). At Lolland, farmers are vulnerable to flooding problems due to low-lying lands, while in Holstebro farmers are actually asked to let their farmland flood (for a compensation) to help solve flooding problems in the city.
The preliminary analysis of data shows that perceptions of climate change experiences differ between the two regions. In general, farmers at Lolland report that they have been observing more frequent extreme or heavy precipitations over their years farming when compared to farmers in Holstebro (Figure 1). Further analysis of the national data will examine whether the difference owes to the fact that Lolland farmers experienced more negative consequences.
Figure 1. Have you observed more frequent extreme or heavy precipitations in your farming area within the years you have been on the farm? Note: Lolland n=36 (response rate 16%). Holstebro n=81 (response rate 18%).
In Figure 2 we asked those farmers who did experience more precipitation about the effects on the crop. It is apparent that these farmers have experienced substantial losses – in particular at Lolland, where a majority had a loss of 10-29% of the hardest struck crop.

Figure 2. Think about the worst of such precipitation events - how much did that event affect the crop which was struck the hardest? (Note: Lolland n=24. Holstebro n=23).
We also asked about crop changes in order to ascertain whether climate change is affecting crop choice. Table 1 shows Holstebro farmers’ weighing of different reasons for their choices. For slightly less than half of the farmers, climate changes like changes in precipitation and temperature haven’t had an effect on their crop switches, and for most farmers it is not very important, but nevertheless, for approximately half of the farmers, these changes do have some effect – they are adapting to a changing climate.
|
pct
|
1
(Not at all)
|
2
|
3
|
4
|
5
(To a very high degree)
|
Don't know
|
|
Possibility of higher yield
|
30
|
9
|
25
|
11
|
25
|
0
|
|
Better price on crop
|
36
|
9
|
11
|
27
|
14
|
2
|
|
Changes in precipitation
|
45
|
16
|
18
|
14
|
2
|
5
|
|
Changes in temperature
|
43
|
27
|
16
|
9
|
2
|
2
|
|
Changes in salinity
|
64
|
18
|
5
|
5
|
0
|
9
|
|
Changes in land productivity
|
45
|
7
|
18
|
14
|
14
|
2
|
|
Changes in labor avail./cost
|
50
|
23
|
9
|
5
|
11
|
2
|
|
Changes in env./climate/agri policies
|
34
|
16
|
9
|
20
|
16
|
5
|
|
Changes in pests
|
55
|
14
|
14
|
9
|
2
|
7
|
|
Risk for developing resistance
|
57
|
16
|
11
|
11
|
2
|
2
|
|
Changes in draining conditions
|
59
|
16
|
14
|
7
|
5
|
0
|
|
Other
|
40
|
0
|
7
|
7
|
40
|
7
|
Table 1. Please indicate how important each of the following reasons has been for changing your crop(s). Scale 1 (not al all) to 5 (to a very highe degree). Only Holstebro farmers. Note: n=44 (for the category 'other' n=15, the remaining 29 have probably found this category irrelevant)
References
-
FAO 2007. Adaptation to climate change in agriculture, forestry and fisheries: Perspective, framework and priorities. Rome: FAO.
-
Wheeler, T. & Tiffin, R. 2009. Costs of adaptation in agriculture, forestry and fisheries. In: PARRY, M. (ed.) Assessing the costs of adaptation to climate change – A review of the UNFCCC and other recent estimates. London: International Institute for Environment and Development & Grantham Institute for Climate Change
-
EC 2013. An EU strategy on adaptaion to climate change. Brussels: European Commission.
-
Holstebro Municipality, 2011, Oversvømmelse i Holstebro – Storå gik over sine bredder den 16. januar 2011.


